J. van der Grinten*, J. C. Christiaanse, A. J. H. M. Reniers, F. Taal, J. Figlus, J. A. A. Antolínez
1 Delft University of Technology, Netherlands
2 Texas A&M University, USA
* Corresponding author: meye.vandergrinten@gmail.com
Introduction
Wave runup observations are crucial for enhancing our understanding of nearshore processes and play a key role in coastal management. They provide valuable data that helps validate predictive models of inundation frequencies and erosion rates, both of which are essential for assessing the vulnerability of coastal ecosystems and infrastructure. However, automated algorithms used to extract the instantaneous water line from video imagery face significant challenges under dissipative conditions. In particular, the presence of a seepage face and the lack of contrast between the sand and the swash make accurate extraction difficult, often requiring time-intensive data quality control or manual digitization. This research aims to develop automated frameworks for accurate wave runup extraction from video imagery, addressing challenges posed by highly dissipative coastal conditions.
Objective and Methods
This study focuses on improving wave runup detection using video imagery collected from Galveston Island, Texas, along the Gulf of Mexico, where timestack images were extracted for analysis. Two novel methods were developed to address challenges associated with dissipative conditions: one based on color contrast (CC) and the other employing machine learning (ML). The CC method enhances waterline detection by combining texture roughness, measured as local entropy, with saturation. In this approach, images are first binarized using entropy values and then refined through noise reduction applied to the saturation channel. The ML method uses a convolutional neural network (CNN) informed by five preprocessed timestack images as input channels, including grayscale intensity, its time gradient, the saturation channel, and entropy with its time gradient. Both methods were validated using nine manually labeled, 80-minute timestack images.
Results
The CC method demonstrated strong agreement with manually digitized water lines (RMSE = 0.12 m, r = 0.94 for vertical runup; RMSE = 0.08 m, r = 0.97 for 2% runup exceedance (R₂%); RMSE = 3.88 s, r = 0.70 for mean period (Tₘ₋₁,₀)). The ML model also showed good performance (RMSE = 0.10 m, r = 0.96 for vertical runup; RMSE = 0.09 m, r = 0.97 for R₂%; RMSE = 3.51 s, r = 0.79 for Tₘ₋₁,₀). See Figure 1 for comparing the two methods with the manual results. Both methods showed strong agreement with the empirical formula by Stockdon et al. (2006), with RMSE values below 0.13 m and correlations exceeding 0.70, demonstrating their reliability for runup prediction. The ML method holds promise for long-term analysis but faces challenges with unseen data. Future work could focus on improving the CNN architecture, incorporating additional data, and testing across diverse environments to enhance robustness. The CC method remains robust for extreme value and wave-by-wave analysis under dissipative conditions. Together, these methods reduce the need for manual processing and support real-time coastal monitoring and predictive modeling.
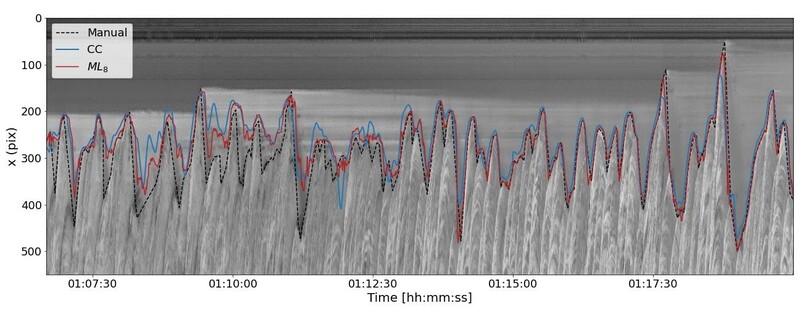
Figure 1: Section timestack from November 14th (video ID: GX050084), with the manually digitized water line (back dashed), and the CC (blue solid) and ML results (red solid).
