
S. de Vries1*, T. Meijer , B. Hofland1 , C, van IJzendoorn2
1 Delft University of Technology, The Netherlands; 2 Utrecht University, The Netherlands
* Corresponding author: sierd.devries@tudelft.nl
Introduction
The morphology of coastal dunes changes with time. Long term sediment supply and aeolian wind forcing may cause dunes to grow gradually and storms may cause dunes to erode. Yearly measurements of dune morphology collected over several decades have revealed linear development of dune volumes at different locations (e.g. de Vries et. al., 2012; Strypsteen et. al., 2019). However, the spatially varying magnitude of these growth rates on decadal scales cannot be explained yet.
Sustained shoreface nourishments in the marine part of the coastal profile may stimulate the growth of coastal dunes indirectly by reducing storm erosion and/or increase the sediment supply to the aeolian system. It could therefore be expected that decadal trends in dune growth rates increase at locations that are affected by nourishments.
In this paper the decadal development of dynamic coastal dunes affected by shoreface nourishments is investigated. The extensive measurements along the Dutch coastal zone (since 1965 to date) and the sustained national nourishment program, in the order of 10 million cubic meters of sediment added to the coastal system on a yearly basis (since 1990 to date, Brand et. al., 2022), provides a unique opportunity to unravel the effects of shoreface nourishments and storms on decadal scale dune dynamics.
Objective and Methods
For this study the Dutch JARKUS dataset (JAaRlijkse KUStmeting) is employed. The JARKUS dataset consists of topographic measurements that include foreshore, beach and dune area along approximately 350km coastline collected yearly since 1965. All yearly data are interpolated to fixed transects that are spaced 200-250m alongshore. The JARKUS Analysis Toolbox (‘JAT’ as described in van IJzendoorn et. al., 2021) is used to analyze the measured topographic profiles and derive yearly dune volumes at 1033 transect locations (where only transect locations that contain more than 40 years of data are considered).
Dune volumes are extracted for every year at every transect location following the procedure described in De Vries et. al. (2012). For every transect location a piecewise linear relationship is fitted where it is hypothesized that the start of the nourishment program causes a break in trend of dune volume development. The year of the break in trend and the magnitude of the trends before and after the ‘break point year’ are the free fitting parameters that are optimized by minimizing the root mean square error.
Results
The extracted timeseries of the development of dune volumes indeed show a break in trend at many transect locations along the Dutch coast (see Figure 1 left panel for a clear example). Applying the piecewise linear fit to the extracted dune volume timeseries at all 1033 transect locations leads to a general increase in fitting quality. The ‘break point year’ seems to occur mostly around 1995 when considering all transect locations (Figure 1, right panel).
The current bulk-analysis of the dune volume development and the piecewise linear fits suggests that the nourishment program along the Dutch coast may have caused a break in trend of dune volume development. This break in trend seems to occur mostly around 1990-1995 at many locations. The break in trend may be explained due to the start of the national nourishment program in 1990. The nourishment program may have resulted in a shallower foreshore that could limit storm erosion and accretion of the beach which could have increased the sediment supply for aeolian sediment transport. As the nourishment program may have influenced dune growth, the results of this study have important implications for the integral management of dynamic coastal dunes as part of the sediment sharing coastal profile (foreshore-beach-dune).
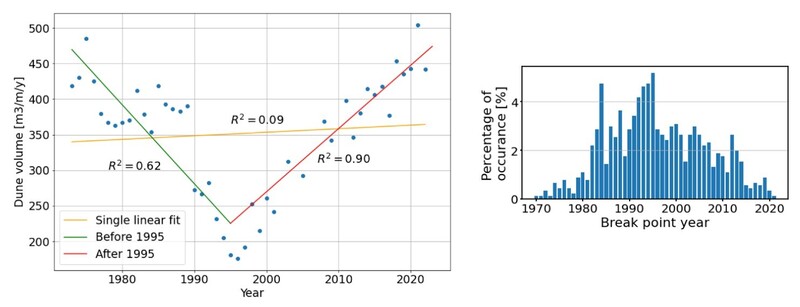
Figure 1. Left panel shows an example of a piecewise linear fit of dune volume development in time with a break in trend at 1995. Before 1995 the dune volume decreased by about 10m3/yr and after 1995 the volume increased by about 10m3/yr (transect ID-7002965). Right panel shows the percentage of occurrence of the break point year when applying the piecewise linear fit to the 1033 considered transect locations. Most occurring break point years seem to be are around 1990-1995.
References
Brand, E., Ramaekers, G., & Lodder, Q. (2022). Dutch experience with sand nourishments for dynamic coastline conservation–an operational overview. Ocean & Coastal Management, 217, 106008.
de Vries, S., Southgate, H. N., Kanning, W., & Ranasinghe, R. W. M. R. J. B., 2012. Dune behavior and aeolian transport on decadal timescales. Coastal engineering, 67, 41-53.
Strypsteen, G., Houthuys, R., & Rauwoens, P. (2019). Dune volume changes at decadal timescales and its relation with potential aeolian transport. Journal of Marine Science and Engineering, 7(10), 357.
van IJzendoorn, C. O., de Vries, S., Hallin, C., & Hesp, P. A., 2021. Sea level rise outpaced by vertical dune toe translation on prograding coasts. Scientific reports, 11(1), 12792.