R. González-Fernández1*, T.D. Price1 , B.G. Ruessink1, J.S. Löhr1
1 Utrecht University, The Netherlands
* R. Gonzalez Fernandez: r.gonzalezfernandez@uu.nl
Introduction
The implementation of shoreface nourishments induces significant morphological perturbations in the nearshore zone, impacting natural morphological features such as alongshore sandbars (Grunnet & Ruessink, 2005). These sandbars play a crucial role in coastal protection by acting as natural barriers that dissipate wave energy during storm events, thereby mitigating beach and dune erosion (Shand et al., 2001). Moreover, sandbars play a role in the redistribution of (nourished) sand in the nearshore. Therefore, understanding their post-nourishment response is essential for assessing coastal safety and ensuring the long-term stability of the nearshore environment.
Objective and Methods
The dynamics of nearshore sandbars along the barrier island of Ameland, The Netherlands, is influenced by both natural and artificial sand inputs. Cyclical shoal attachments (natural inputs) from the outer delta occur at the island’s western tip, while multiple sand nourishments (artificial inputs) have been implemented in the central region since 1998. These complex interactions make it difficult to assess the long-term impact of foreshore nourishments on sandbar dynamics and to separate their effect from natural processes. This study uses JarKus annual bathymetry data of Ameland’s northern coast to identify sandbars and analyze the evolution of their parameters from 1965 to 2023, focusing on their variability in both cross-shore and alongshore directions, while examining the influence of natural and artificial sand inputs.
Results
The results show that foreshore nourishments along Ameland’s northern coast have significantly impacted the nearshore dynamics, particularly the growth and migration of sandbars. Shoal attachments increased the profile volume of the western section and temporarily paused the offshore migration of sandbars. In contrast, nourishments led to an increase in profile volume through increased sandbar volumes in the central and eastern sections, at times doubling the total sandbar volume (e.g., from 400 m3/m to above 800 m3/m after the 1998 nourishment; see Figure 1). Nourishments were also found to pause the offshore migration and promote the development of crescentic patterns, bar switching, and the formation of additional sandbars. The pause in offshore migration has been observed to last longer due to shoal attachments. Nourishments of greater length (e.g., 1998 and 2010) coincided with larger increases in sandbar volume (see Figure 1), although such instances partly coincided with natural sand inputs. In our contribution to the meeting, the key forcing mechanisms responsible for these changes in sandbar characteristics are identified and discussed.
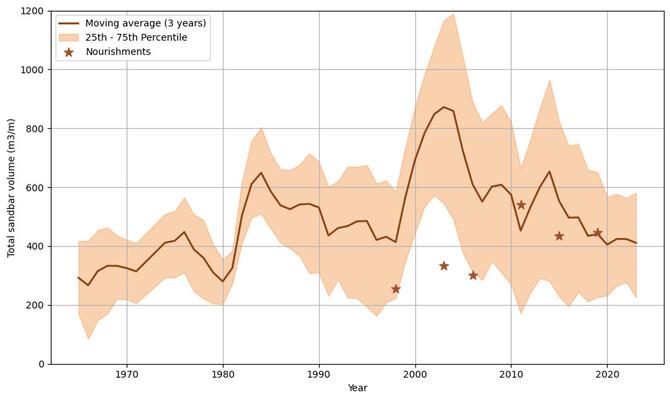
Figure 1. Average total sandbar volume (in m³/m) using a 3-year moving average for the entire study area. Total sandbar volume represents the cumulative sandbar’s volume within each transect. Stars indicate nourishment events and their corresponding volume.
References
Grunnet, N. M., & Ruessink, B. G. (2005). Morphodynamic response of nearshore bars to a shoreface nourishment. Coastal Engineering, 52(2), 119-137.
Shand, R. D., Bailey, D. G., & Shepherd, M. J. (2001). Longshore realignment of shore-parallel sand-bars at Wanganui, New Zealand. Marine Geology, 179(3-4), 147-161.
