
J. Bruil1*, S. Dzimballa1,2 , V. Kitsikoudis1,2, E.M. Horstman1,2
1Marine and Fluvial Systems, University of Twente, Enschede, the Netherlands; 2Living Dikes project
* Corresponding author: j.bruil@student.utwente.nl
Introduction
Salt marshes are critical coastal ecosystems, valued for their ability to attenuate wave energy (Dzimballa et al., 2025) and reduce hydraulic loads on engineered defences (Schoonees et al., 2019). However, global trends reveal increasing lateral erosion of marsh edges, driven by the tide and waves (Bendoni et al., 2021). Existing literature often describes a positive, linear relationship between erosion rates and hydrodynamic forcing (Leonardi et al., 2016), but also a power law relationship was found (Houttuijn Bloemendaal et al., 2023).
Formed as a result of historical semi-natural land reclamations, the Wierum salt marsh in the Wadden Sea experiences erosion at the seaward edge. The marsh edge at this marsh is characterized by near-vertical cliffs with an average height of 0.5 m (Figure 1b). However, there are also parts where there is a gentle or stair-shaped slope towards the mudflat.
Objective and Methods
The Wierum salt marsh is used as a case study to investigate whether there is a relationship between cliff retreat and hydrodynamic forcing. The influence of edge complexity and vegetation on local erosion rates is also tested.
Aerial imagery and hydrodynamic data spanning from 2016 until 2024 is included. The marsh edge retreat is quantified using aerial photographs and digital elevation models (DEM’s) (Figure 1a). Hydrodynamic forcing was analysed using the wave power (P in W/m) and wave thrust (T in N/m) calculated from wave height and water depth, assuming shallow water conditions. Dimensionless wave power and wave thrust are obtained by dividing by the average over the whole time period. Additionally, the inundation frequency was determined as percentage of hours per year that there is water at the cliff. The hydrodynamic parameters calculated are plotted against the dimensionless retreat rate per year and a linear and power law model are fitted against the data to find a possible relationship.
The spatial differences in erosion rate are examined and compared to vegetation density and marsh boundary complexity. These are quantified respectively through Normalized Difference Vegetation Index (NDVI) determined from satellite data and fractal dimensions of the edge shape using the box-counting method.
Results
The average marsh edge retreat rate between 2016 and 2023 is 1.8 m/year. The findings indicate a positive relationship between wave power and average marsh edge erosion rate (Figure 1c). The linear results are well in line with existing literature (Leonardi et al., 2016; McLoughlin et al., 2015). A positive relationship between wave thrust and erosion rate was found using a linear fit (E* = 0.90 T*, R2 = 0.34) and a power law fit (E* = 1.00 T* ^ 0.50, R2 = 0.28). A negative relation was found between the frequency of inundation and erosion rate. This could indicate that the wave force at the time of inundation rather than the total period of inundation influences lateral cliff retreat.
The marsh edge complexity was found to correlate negatively with erosion rate, indicating that a marsh with a more smooth marsh edge erodes faster than a marsh with a more complex marsh edge. This is also observed in literature, even though methods and scales vary greatly (Leonardi et al., 2016). No convincing relationship was found between vegetation density and erosion rate.
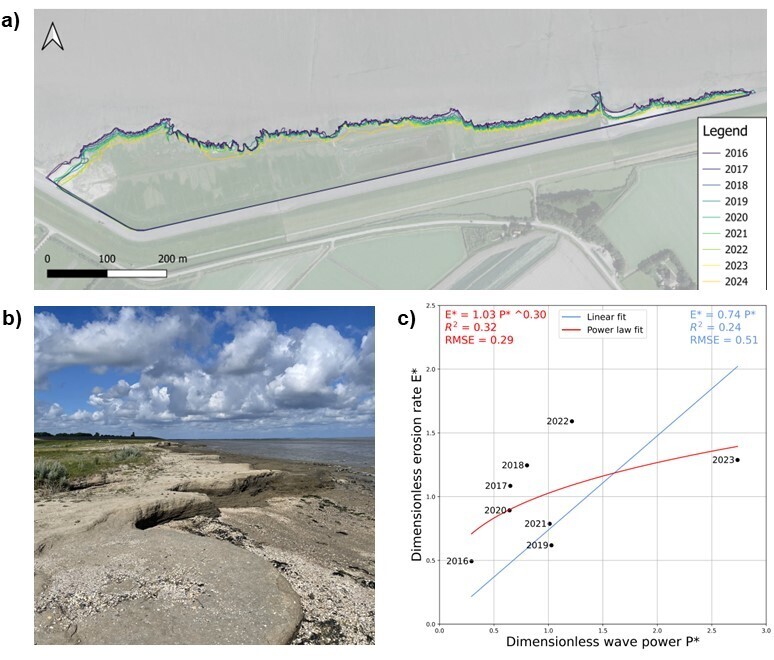
Figure1: a) The Wierum marsh edge location from 2016 until 2024, showing a lateral retreat. A background the aerial image of 2016 is used.; b) Picture of the cliffs at the Wierum marsh; c) Relation between dimensionless wave power (P*) and dimensionless erosion rate (E*) including a linear fit (blue) and a power law fit (red).
References
Bendoni, M., Georgiou, I. Y., & Novak, A. B. (2021). Marsh Edge Erosion. In D. FitzGerald & Z. Hughes (Eds.), Salt Marshes (1st ed., pp. 388–422).
Dzimballa, S., Willemsen, P. W. J. M., Kitsikoudis, V., Borsje, B. W., & Augustijn, D. C. M. (2025). Numerical modelling of biogeomorphological processes in salt marsh development: Do short-term vegetation dynamics influence long-term development? Geomorphology, 471, 109534.
Houttuijn Bloemendaal, L. J., FitzGerald, D. M., Hughes, Z. J., Novak, A. B., & Georgiou, I. Y. (2023). Reevaluating the wave power-salt marsh retreat relationship. Scientific Reports, 13(1), 2884.
Leonardi, N., Defne, Z., Ganju, N. K., & Fagherazzi, S. (2016). Salt marsh erosion rates and boundary features in a shallow Bay: Indicators Salt Marsh Erosion New Jersey. Journal of Geophysical Research: Earth Surface, 121(10), 1861–1875.
Leonardi, N., Ganju, N. K., & Fagherazzi, S. (2016). A linear relationship between wave power and erosion determines salt-marsh resilience to violent storms and hurricanes. Proceedings of the National Academy of Sciences, 113(1), 64–68.
McLoughlin, S. M., Wiberg, P. L., Safak, I., & McGlathery, K. J. (2015). Rates and Forcing of Marsh Edge Erosion in a Shallow Coastal Bay. Estuaries and Coasts, 38(2), 620–638.
Schoonees, T., Gijón Mancheño, A., Scheres, B., Bouma, T. J., Silva, R., Schlurmann, T., & Schüttrumpf, H. (2019). Hard Structures for Coastal Protection, Towards Greener Designs. Estuaries and Coasts, 42(7), 1709–1729.