
B.W. Pleij1*, M. van der Vegt1 , N.H. Nienhuis1
1 Utrecht University, Netherlands
* Corresponding author: b.w.pleij@students.uu.nl
Introduction
Tidal dynamics have traditionally been studied using fixed tide gauges, which provide high temporal resolution but are limited in spatial coverage. To understand tidal dynamics across larger regions, numerical models have been used. With the launch of the SWOT (Surface Water and Ocean Topography) satellite in 2022, it is now possible to study water levels with high spatial resolution (2 km x 2 km resolution) over large areas (swath of 120 km wide, with a nadir gap of 20 km). However, a major drawback is that SWOT has low temporal resolution, the satellite will have a 21-day repeat orbit (Morrow et al., 2019).
Objective and Methods
This study utilizes the newly available SWOT data to map the tidal dynamics of the North Sea at a high spatial resolution of 2 km. First, the quality of the SWOT data was assessed through comparison with in-situ measurements from 38 tide gauges from Rijkswaterstaat (Rijkswaterstaat Waterinfo). Second, the SWOT satellite data and data from a tide gauge were integrated to create a representative tidal signal with high spatial and temporal resolution. A harmonic analysis was performed on this data set enhance our understanding of tidal behaviour in the North Sea.
Results
The comparison between SWOT and Rijkswaterstaat data demonstrates a strong 1:1 correlation and small bias for North Sea stations, confirming the reliability of the satellite observations. The average RMSE is 13 cm, and the average bias is 7 cm, with SWOT values consistently higher than Rijkswaterstaat data. However, in the Wadden Sea, the quality of SWOT data is reduced, likely due to noise originating from exposed land areas. By relating all SWOT images to local time of high water at Vlakte van de Raan and by scaling the data with the observed tidal range at moment of the SWOT image, a comprehensive data set was created that condenses the sparse temporal data into one representative tidal cycle. For the first time, we show the large-scale tidal dynamics solely based on data. The data reveals the propagation patterns and the changes in the tidal amplitude. We will compare the observed tidal patterns with model results and discuss similarities and differences.
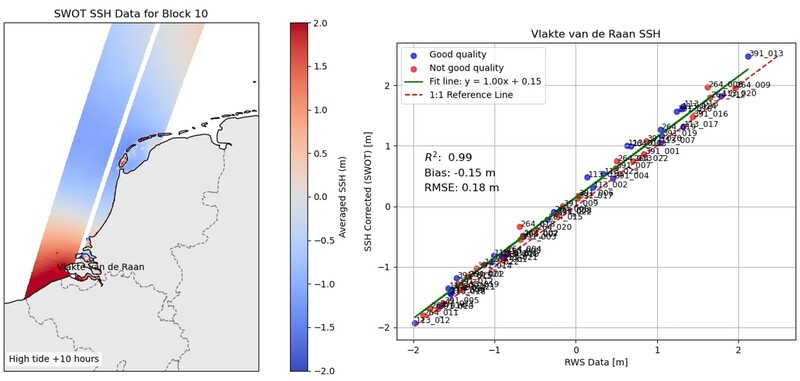
Fig 1 SWOT data shown for 10 hours after high water at Vlakte van de Raan (image from 6 Dec 2024) - Fig 2 Comparison of SWOT and Rijkswaterstaat data
References
Morrow, R., Fu, L., Ardhuin, F., Benkiran, M., Chapron, B., Cosme, E., D’Ovidio, F., Farrar, J. T., Gille, S. T., Lapeyre, G., Traon, P. L., Pascual, A., Ponte, A., Qiu, B., Rascle, N., Ubelmann, C., Wang, J., & Zaron, E. D. (2019). Global Observations of Fine-Scale Ocean Surface Topography With the Surface Water and Ocean Topography (SWOT) Mission. Frontiers in Marine Science, 6. https://doi.org/10.3389/fmars.2019.00232
Rijkswaterstaat Waterinfo. (n.d.). https://waterinfo.rws.nl/