
V. Basnayake1*, T.M. Duong1,2 , R. Ranasinghe1,2,3, K.M. Wijnberg1, R. Almar4
1 University of Twente, Netherlands; 2IHE Delft Institute for Water Education, Delft, The Netherland, 3Deltares, Delft, The Netherlands, 4Laboratoire d'Etudes en Geophysique et Oceanographie Spatiales (LEGOS), Toulouse, France
* Corresponding author: b.m.v.basnayake@utwente.nl
Introduction
The vulnerability of coastal environments can be understood by evaluating the susceptibility of coastlines to coastal hazards such as erosion and flooding, and their capacity to resist and recover from the impacts of hazards. Coastal vulnerability assessments can be used to identify the level of vulnerability at different locations along coastlines. A widely used method to express coastal vulnerability is the Coastal Vulnerability Index (CVI), because of its straightforwardness and ease of application. Several methods are suggested in the literature for estimating the CVI using different indicators and these methods have been applied to different locations in various countries. Often these CVI studies are being carried out at the local scale or regional scale. However, at the global scale, a consistent coastal vulnerability assessment is still lacking. Global scale coastal vulnerability assessments will be important for informing macro-scale decisions. In this context, this study calculates global CVIs, aggregated at country level, for the present-day condition by using four different CVI methods, and compares these CVIs to understand how the CVIs vary depending on the method of calculation.
Objective and Methods
In this study, the four different CVI calculation methods suggested by respectively López et al. (2016), Thieler & Hammar-Klose (2000), Shaw et al. (1998) and Gornitz (1991), were adopted to compute and compare the country median CVI for the global coastline. All four methods use geophysical and coastal forcing indicators to determine the vulnerability of coastal environments. Openly available global coastal datasets were used for each indicator at the sampling locations spread over the global coastline. The selected indicators and the method of assigning the vulnerability rankings differ from one method to another (for more details refer to (Koroglu et al., 2019). The overall CVI value at a sampling location was calculated by taking the square root of the product mean of vulnerability ranks given for each indicator at that location.
In each method, calculated vunerability index values were classified into five equal-sized vulnerability classes from Very Low to Very High vulnerability. Value ranges for each vulnerability class were decided based on the percentile ranges (i.e., the Lowest 20% of the locations were classified as ‘Very Low’ etc.). Further, CVI classes derived in this study were validated with those from the previous local and regional studies conducted at different locations worldwide. The pointwise CVI values were then aggregated to the country level by taking the median CVI value for each country and classified them into the CVI classes.
Results
Figure 1 shows the variation of median CVI classes calculated at the country level for the four CVI methods. For many countries, median vulnerability classes change according to the method used in calculating the CVI. These differences in CVI classes can be due to the different approaches followed in each method, particularly in assigning the vulnerability ranks to individual indicators. Among the 146 countries analyzed in the study, 26 countries (i.e., Australia, Bahrain, India, Lithuania, Namibia, Sierra Leone, United States, Yemen, China, Djibouti, Ecuador, Georgia, Madagascar, Malaysia, Thailand, Costa Rica, Japan, Singapore, South Korea, Bosnia and Herzegovina, Croatia, Greece, Malta, Montenegro, Norway, Slovenia) exhibit the same median vulnerability class across all four CVI methods. Also, all four methods indicate that the majority of Very High/ High vulnerability countries are located in the tropics or subtropics.
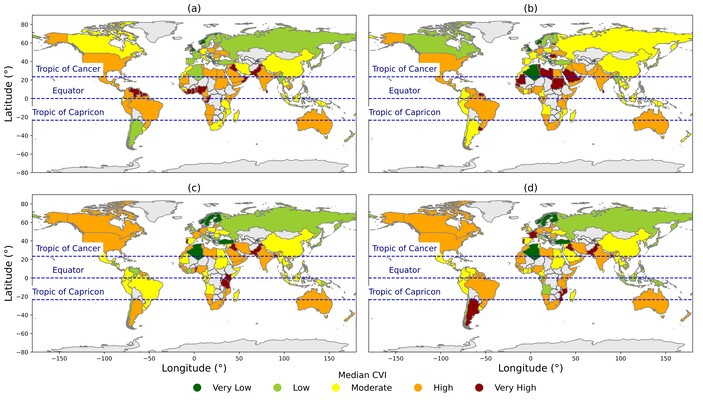
Figure 1: Median CVI classes calculated at the country level for the four CVI methods suggested by (a) López et al., (2016), (b) (Thieler & Hammar-Klose, 2000), (c) (Shaw et al., 1998) and (d) (Gornitz, 1991)
References
Gornitz, V. (1991). Global coastal hazards from future sea level rise. Palaeogeography, Palaeoclimatology, Palaeoecology, 89(4), 379–398. https://doi.org/10.1016/0031-0182(91)90173-O
Koroglu, A., Ranasinghe, R., Jiménez, J. A., & Dastgheib, A. (2019). Comparison of Coastal Vulnerability Index applications for Barcelona Province. Ocean and Coastal Management, 178. https://doi.org/10.1016/j.ocecoaman.2019.05.001
López, R. M., Ranasinghe, R., & Jiménez, J. A. (2016). A Rapid, Low-Cost Approach to Coastal Vulnerability Assessment at a National Level. Journal of Coastal Research, 32(4), 932–945. https://doi.org/10.2112/JCOASTRES-D-14-00217.1
Shaw, J., Taylor, R. B., Forbes, D. L., Ruz, M. H., & Solomon, S. (1998). Sensitivity of the coasts of Canada to sea-level rise. Bulletin of the Geological Survey of Canada, 505, 1–79.
Thieler, E. R., & Hammar-Klose, E. S. (2000). National assessment of coastal vulnerability to sea-level rise: Preliminary results for the U.S. Pacific Coast. In Open-File Report. https://doi.org/10.3133/ofr00178