F.F. van Rees1*, P. Berghuis1 , V. Reijers1
1 Utrecht University, Netherlands;
* Corresponding author: floris.van.rees@nioz.nl
Introduction
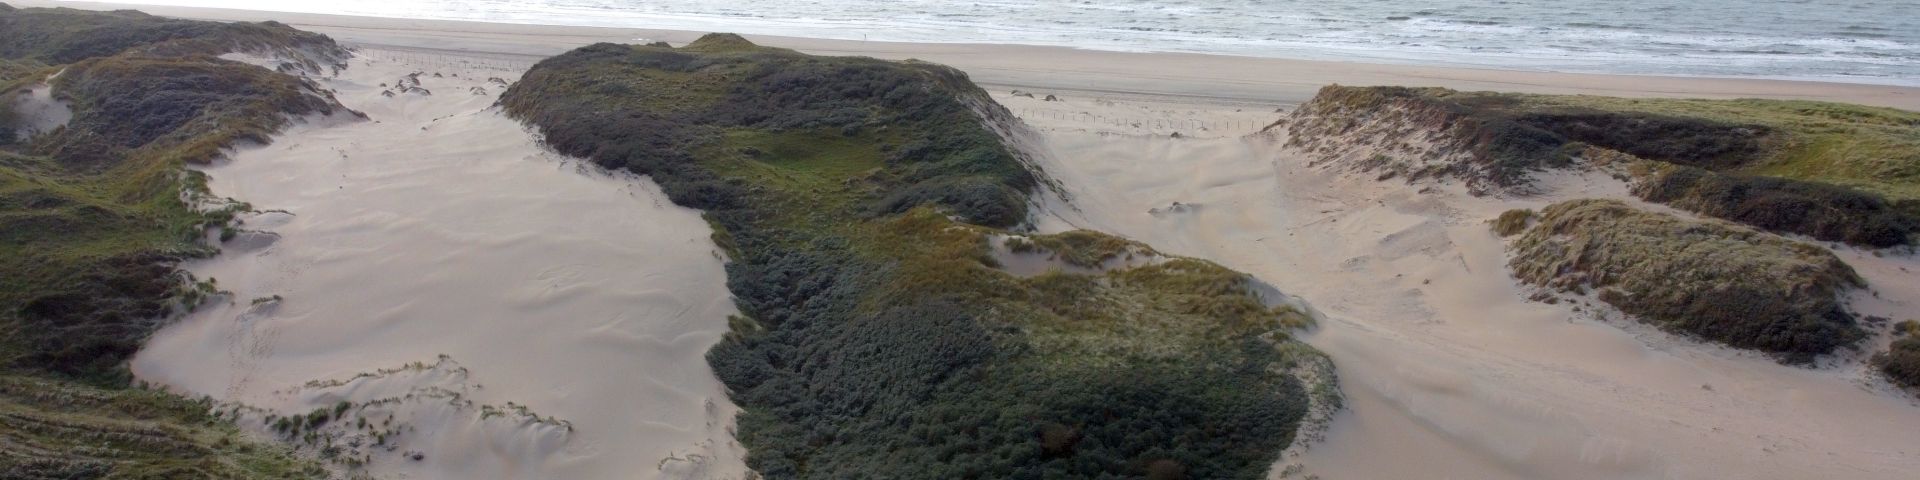
Coastal dunes play a crucial role in protecting shorelines from erosion and flooding, yet their resilience is increasingly challenged by climate change and rising sea levels (Haigh et al., 2016). While abiotic processes such as wind, waves, and sediment availability shape dune morphology (Edelman, 1972), vegetation also plays a key role in stabilizing dunes through plant-sediment interactions. Species-specific plant traits influence dune height and slope, with Uniola paniculata forming narrower dunes with lower sand accretion than Ammophila breviligulata due to differences in growth form (Hacker et al., 2019).
Beyond inherent plant traits, allochthonous nutrient inputs, such as seabird guano, further influence vegetation dynamics, modifying plant productivity and sand capture efficiency (Anderson et al., 2008; Buelow et al., 2018). Therefore, guano-driven changes in vegetation cover effects morphology on sandy coastal ecosystems (Reijers et al., 2024). Along the U.S. East Coast, Ammophila breviligulata and Uniola paniculata are expanding their ranges due to climate change, raising questions about how shifting species distributions and nutrient dynamics will alter dune morphology and resilience.
Objective and Methods
This study quantifies how biotic factors influence dune height and morphology along the U.S. East Coast. We assess deviations from abiotic-based dune height predictions and link them to the distribution of Ammophila brevigulata and Uniola paniculata. We examine species differences in sand-trapping traits, their impact on dune morphology, and how allochthonous nutrients influence trait variability.
To achieve this, we use remote sensing, field surveys, and stable isotope analysis. Dune heights are derived from DEMs and predicted using PCA of abiotic variables, with residuals analyzed across the species' latitudinal ranges. A field survey quantifies key plant traits, while drone-derived DEMs and orthomosaics reveal how these traits shape dunes. Stable isotope analysis links nutrient subsidies to plant traits, clarifying their effect on sand-trapping capacity.
Results
GLM models for dune height, based on abiotic predictors, explained 75.9% and 73.6% of the deviance in dune elevation. Model residuals were positive in the Ammophila brevigulata range and negative in the Uniola paniculata range, particularly in the 34°–38° latitude transition zone, where increasing Ammophila brevigulata presence coincides with a gradual rise in dune height. Post-hoc emmeans tests revealed that the species differ most in the degree of inhomogenous shoot orientation, particularly between embryo dunes and foredune crests. Drone imagery shows that Ammophila brevigulata exhibits a distinct lateral growth strategy, aligning at ~45° to the dune slope. In contrast, Uniola paniculata lacks this clear orientation. Allochthonous nutrient assimilation increases the spatial inhomogeneity of Ammophila brevigulata on both embryo dunes and foredune crests. However, for Uniola paniculata, this effect is weaker on embryo dunes and slightly negative on foredune crests. This suggests that nutrient-driven trait changes in Ammophila brevigulata may enhance its ability to modify dune morphology, while Uniola paniculata exhibits greater resistance to allochthonous nutrient influences.
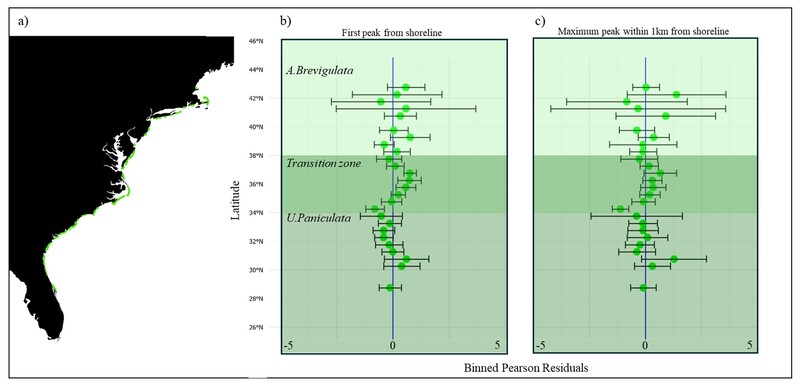
Panel a) shows the outline of the USA, in which green points depict natural coastal dune systems included in the analysis, the y-axis expresses latitude. Pearson residuals based on GLMs for the prediction of dune height are averaged over 0.5° latitude intervals and are plotted versus latitude mid-point of the bin. Panel b)shows the residuals based on the GLM to predict the first elevation peak from the shoreline (proxy for dune height). Panel c) shows the maximum elevation peak within 1 km from the shoreline (proxy for dune height). The error bar displays the standard deviation in Pearson residuals per latitude bin. The latitudinal range of A. Brevigulata and U. Paniculata is depicted in light green and dark green respectively.
References
Anderson, W. B., Wait, D. A., & Stapp, P. (2008). Resources from another place and time: Responses to pulses in a spatially subsidized system. Ecology, 89(3), 660–670. https://doi.org/10.1890/07-0234.1
Buelow, C. A., Baker, R., Reside, A. E., & Sheaves, M. (2018). Nutrient subsidy indicators predict the presence of an avian mobile-link species. Ecological Indicators, 89(June 2017), 507–515. https://doi.org/10.1016/j.ecolind.2018.02.029
Edelman, T. (1972). Dune erosion during storm conditions. Coastal Engineering, 1305–1311. https://doi.org/10.1061/9780872620490.073
Hacker, S. D., Jay, K. R., Cohn, N., Goldstein, E. B., Hovenga, P. A., Itzkin, M., Moore, L. J., Mostow, R. S., Mullins, E. V., & Ruggiero, P. (2019). Species-specific functional morphology of four US atlantic coast dune grasses: Biogeographic implications for dune shape and coastal protection. Diversity, 11(5). https://doi.org/10.3390/D11050082
Haigh, I. D., Wadey, M. P., Wahl, T., Ozsoy, O., Nicholls, R. J., Brown, J. M., & Gouldby, B. (2016). Spatial and temporal analysis of extreme sea level and storm surge events around the coastline of the UK. Scientific Data, 3, 160107.
