
Roy van Weerdenburg1,2*, Thijs van Kessel2, Bas van Maren1,2, Qilong Bi2, Martijn Klein Obbink3 & Bram van Prooijen1
1Delft University of Technology; 2Deltares; 3Rijkswaterstaat
*Corresponding author: r.j.a.vanweerdenburg@tudelft.nl
Introduction
Channel-shoal systems in the central part of the Dutch Wadden Sea typically become muddier with increasing distance from the tidal inlet, towards both the mainland coast and tidal divides. The resulting increase in mud availability leads to higher turbidity, reducing light availability at the seabed, and necessitates dredging to maintain the fairway. For example, the fairway to the Holwerd ferry terminal, located just west of Ameland’s tidal divide, is maintained by dredging of approximately 0.8-1.2 million cubic meters of sediment annually. This volume is roughly four times the yearly net mud supply to the Ameland Basin (Colina Alonso et al., 2024), suggesting that most of the channel deposition results from mud dynamics within the basin, including local resuspension and channel-shoal exchange. Optimizing sediment management strategies in the Dutch Wadden Sea thus demands a quantitative understanding of the sediment dynamics in the system.
Objective and Methods
We aim to better understand the mechanisms driving variations in suspended sediment concentrations (SSC) and associated dredging volumes in the Ameland Basin across timescales ranging from hours to years. We use a set of field observations at measurement stations Holwerd and Dantziggat, collected by Rijkswaterstaat since July 2022. This dataset contains local hydrodynamics (i.e., water levels, flow velocities, and wave conditions) and water quality parameters, with turbidity being most relevant to our analysis. In addition, we use the SIBES dataset (Bijleveld et al., 2012) to estimate mud availability in the seabed, MWTL measurements to assess SSC variations over multiple years, records of dredging and disposal activities, and KNMI meteorological observations.
Results
At short (intra-tidal) timescales, peaks in SSC are observed during peak ebb and flood velocities. The largest wave heights occur during periods of significant water level set-up. However, this set-up reduces the wave impact on the seabed (i.e., the penetration of orbital velocities down the water column), meaning SSC is often higher during moderate rather than extreme wave heights. At longer timescales, the largest (residual) transport rates are associated with strong winds from the west-southwest, which enhance flow and transport in the flood direction, and with mild to strong winds from the east, which enhance flow and transport in the ebb direction. Superimposed on a seasonal variation, with higher SSC in fall and winter, SSC were particularly high from October 2023 to April 2024. We hypothesize that a sequence of wind conditions caused an increase in mud availability in October 2023, which remained in suspension throughout the winter months, until calmer spring conditions in May 2024.
In this presentation, we will explore the long-lasting impact of specific events on mud availability and SSC. Quantitatively understanding these dynamics helps evaluate fluctuations in for example dredging volumes and saltmarsh growth, as well as their implications for sediment management strategies.
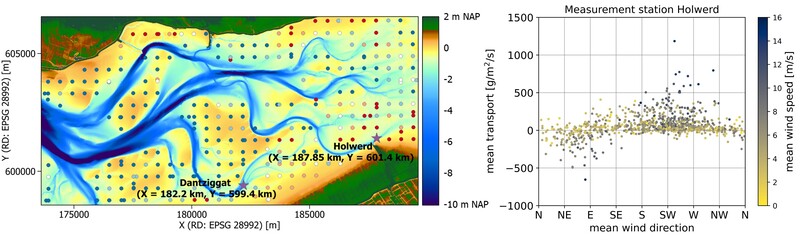
Figure 1: Left: Bathymetry map of the Wadden Sea south of Ameland, with the locations of measurement stations Dantziggat and Holwerd indicated by purple stars. Blue dots indicate sandy (pmud 0.3-0.4) areas, according to SIBES data (Bijleveld et al., 2012). Right: Residual transport in flood (positive) and ebb (negative) direction with varying wind conditions.
References
Bijleveld, A.I., van Gils, J.A., van der Meer, J., Dekinga, A., … & Piersma, T. (2012) Designing a benthic monitoring programme with multiple conflicting objectives. Methods in Ecology and Evolution, 3, 526-536.
Colina Alonso, A., van Maren, D.S., Oost, A.P., … & Wang, Z.B. (2024). A mud budget of the Wadden Sea and its implications for sediment management. Communications Earth & Environment, 5:153.