
O. Verhage1*, S.M. Arens2 , C.J. Beets1, J.B.W. Stuut3, M.A. Prins1
1 Vrije Universiteit Amsterdam, The Netherlands; 2 Arens Bureau voor Strand- en Duinonderzoek, The Netherlands; 3 NIOZ, The Netherlands
* Corresponding author: o.verhage@vu.nl
Introduction
As an integral part of the sandy coastal system, aeolian dunes provide protection against rising sea levels, freshwater storage, diverse ecosystems and recreational areas. Traditional Dutch dune management focused on stabilizing dunes by planting marram grass, increasing height and steepness of foredunes, thereby reducing aeolian sand transport towards the hinterland, resulting in biodiversity loss. Modern dune management focuses on remobilizing dunes to restore natural dynamics.
This study focuses on Zuid-Kennemerland, where artificial notches and blowouts were created in 2013 to promote aeolian transport. The effectiveness of notches is demonstrated through measurable elevation changes and observable sand bodies (Ruessink et al., 2018; Van Kuik et al., 2022). However, suspended sand deposition in the hinterland is typically to low to be detected, leading to underestimates of the total sand flux and their influence on soil composition in the Grey Dune habitat.
Here we present data from 15 sand traps to provide insights into spatial and temporal transport variability of suspended aeolian sand flux for over a decade. Findings will help refine models for dune remobilization and sand transport, improving management strategies. Understanding these processes is crucial for predicting long-term impacts on dune systems in response to climate change and human interventions.
Objective and Methods
The research aim is twofold: to study the spatiotemporal variability of aeolian sediment flux in relation to meteorological conditions and to improve understanding of suspended sand transport in a remobilised coastal dune system. Using a grid of 15 sand traps (see figure) placed in four rows with increasing distances from the foredune, the sand was captured. The traps are designed from a 80 cm PVC pipe standing 1.5 m above ground level. The 180° opening faces the dominant southwestern wind direction. A 106 μm mesh allows air and smaller particles to flow through while trapping larger particles. The traps were emptied biweekly and weight measurements were used to calculate flux. Data have been collected from October 2013 to December 2023.
Meteorological data from KNMI weatherstation 225 (IJmuiden) provides 10 minute-resolution wind speed and direction data. This data was recalculated into daily values and were used to correlate the sand flux with the wind events during each sampling interval. Satellite imagery from 2014 to 2023 was analysed to monitor morphological changes in relation to sediment flux trends. The spatiotemporal data is plotted in contour maps of the cumulative flux.
Results
The sand traps collected approximately 60 kg of sand in total. The results show that storms (average hourly windspeed >20.8 m/s) have a major impact on suspended aeolian sand flux in the study area. Suspended aeolian sand reaches distances of at least 700 meters from the foredune crest. Storms are responsible for up to 88 % of the total decadal suspended sand flux, with the highest fluxes during severe storm events (average hourly windspeed >24.4 m/s), highlighting their importance for the sand suspension transport. The spatial distribution of sand traps, relative to the notches and the blowouts, influences the recorded sand flux trend over time. Traps downwind of notches (e.g. A1) show a declining flux over time, as a function of reduced transport capacity through the widening of notches. In contrast, the traps downwind of blowouts (e.g. C4) show an increasing flux trend, related to the progradation of depositional lobes towards the sand traps. Sand traps not influenced by notches or blowouts (e.g. A2) show a linear trend over time. We demonstrate that these trends are not influenced by increases or decreases in windiness during the sampling period.
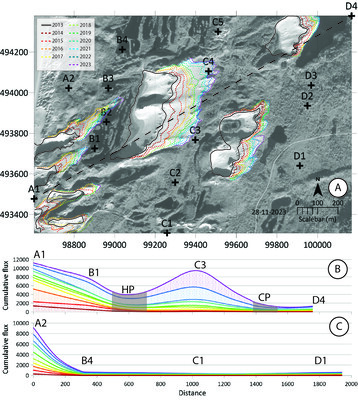
A) satellite imagery of the research area where the depositional sand lobes behind the notches and blowouts have been traced each year. On the map the original shape of the blowouts in 2013 is indicated by the black line. The location and name of the sand traps is indicated by the crosses. B) profile A1-D4 shown as a cross section showing the interpolated cumulative sample weight data of the sand traps. HP and CP indicate the extent of the Houtglop and Cremermeer Parabole blowouts. C) profile A2-D1 is a reconstruction of flux in an unnotched system, based on data from sand traps A2, B4 C1 and D1.
References
van Kuik, N., de Vries, J., Schwarz, C., & Ruessink, G. (2022). Surface-area development of foredune trough blowouts and associated parabolic dunes quantified from time series of satellite imagery. Aeolian Research, 57, 100812.
Ruessink, B., Arens, S., Kuipers, M., & Donker, J. (2018). Coastal dune dynamics in response to excavated foredune notches. Aeolian Research, 31, 3-17.