P.E. Kindermann1,2*, J.A.A. Antolínez1 , O. Morales-Nápoles1
1 Delft University of Technology, The Netherlands; 2 HKV Lijn in water, The Netherlands
* Corresponding author: p.e.kindermann@tudelft.nl
Introduction
The Dutch coast is characterized by dikes, dunes, and structural barriers with low-lying, densely populated hinterland, which makes the area vulnerable to coastal flooding. Extreme storms above the North Sea are the main driver of coastal flood risk in the Netherlands, resulting in high waves and extreme sea levels due to storm surge. Therefore, the reliability of coastal flood forecasting models is of great importance: accurate short-term forecasts (up to 10 days lead time) are necessary for operational decision-making processes (e.g. closing the storm surge barriers on time), while mid-term forecasting (more than 10 days lead time) is useful for the planning of maintenance, for example. Traditionally, storm forecasting relies on numerical weather prediction and hydrodynamic models, but for long lead times computational demands increase significantly. In such cases, machine learning offers a promising alternative. With recent advances in short-, mid-, and long-range forecasting, extensive datasets of simulated weather and hydrodynamic conditions are now available (e.g. Hersbach et al. (2020)). These datasets can be used to train machine learning models for predicting extreme sea levels and to enhance our understanding of the driving mechanisms of extreme sea levels.
Objective and Methods
This study aims to investigate the potential of various clustering techniques for predicting extreme sea level probabilities and unraveling their driving mechanisms. Recently, the Royal Dutch Meteorological Institute (KNMI) generated an extensive dataset of simulated sea levels, using the WAQUA-DCSMv5-model with wind data from SEAS5 (van den Brink & de Valk, 2024). This dataset effectively represents approximately 9,000 years of simulated wind fields and sea level time series, which were used as training dataset. From this dataset, extreme storm events were identified, in terms of associated mean sea level pressure fields over the North Sea and time series of wind speed, wind direction, sea levels, and astronomical tide at six locations along the Dutch coast. Two clustering algorithms—Self-Organizing Maps (SOM) and K-Means—were applied and several clustering approaches were explored: (1) based on the parametrization of storm events into nine storm features, (2) using the full storm time series at point locations, and (3) clustering mean sea level pressure fields over the entire North Sea. These approaches were compared in terms of their ability to estimate sea level probabilities. Besides, the results provided insights into driving mechanisms and interactions between storm characteristics.
Results
As an example, results are presented for the SOM algorithm applied to clustering based on storm features. Figure 1 presents the mean feature values for each node from the trained SOM algorithm for location Vlissingen, with each plot corresponding to one of the nine storm features used for clustering. The nodes (hexagons) represent clusters of storms, and the colors indicate the mean feature values for each node. It can be observed that the SOM algorithm effectively captures several physical relationships. For instance, the plots show that southern (180–270°N) wind directions (lower right plot) are generally associated with higher wind speeds (upper left plot) compared to northern wind directions. However, these high wind speeds only result in significant surge heights for western to northern wind directions, as highlighted by the red square. Notably, a few nodes exhibit relatively high sea levels despite low surge heights as indicated by the purple square in the lower center plot. This can be explained by the minimal time offset between the surge peak and astronomical high tide (right center plot), meaning that the maximum surge (almost) coincides with high tide, which results in high sea levels even if the surge is only moderate.
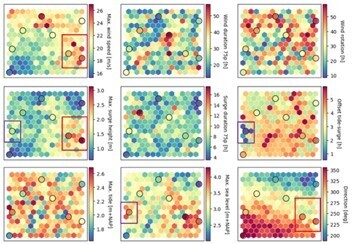
Feature plots resulting from the trained SOM algorithm for location Vlissingen.
References
Hersbach, H., Bell, B., Berrisford, P., Hirahara, S., Horányi, A., Muñoz‐Sabater, J., ..., Thépaut, J. N., (2020), The ERA5 global reanalysis. Quarterly Journal of the Royal Meteorological Society, 146(730), 1999-2049.
De Valk, C.F., van den Brink, H.W., (2024), An appraisal of the value of simulated weather data for quantifying coastal flood hazard in the Netherlands. EGUsphere. [Preprint].
