B.J.A. Huisman1*, V. Dagalaki1, N. Vermeer1, L. Brakenhoff2, Q.. Lodder2
1 Deltares, The Netherlands; 2 Rijkswaterstaat-WVL, The Netherlands
* Corresponding author: bas.huisman@deltares.nl
Introduction
The Dutch Wadden coasts is characterized by a sequence of sandy barrier islands and tidal inlets with eb-deltas. It is known that these islands cannot be considered separate entities, as they are connected through bypassing over the delta's. Intermittent shoal landings take place at the western headlands of the islands at intervals of a few decades. Furthermore, continuous exchange of sediment takes place between the coasts and the (eb-deltas of the) tidal inlets, while island tails export sediment to the eastward located inlets. However, studies that can quantify the behaviour of the island coasts at decadal scales and the exchanges of the eb-deltas with the coast are lacking. Such quantitave information will be necessary though, as we need to be able to explore future sedimant demand of Wadden island coasts to mitigate impacts of future sea level rise scenarios. This research aims at making reliable quantitative hindcasts for all Dutch sandy coastal sections in the framework of the Knowledge program Sea Level Rise of Rijkswaterstaat. The Ameland case is highlighted here as it contains interesting new findings.
Objective and Methods
A 1D coastline model (Unibest-CL+) is used to track the development of the island coast of Ameland over a two-decade period (from 2000 to 2020). Coastlines were derived from the yearly coastal measurements (Jarkus) as a starting-coastline. Also, fourteen cross-shore profiles were derived, which extended from 6m depth to the first dune and were spaced 1 to 4 km apart along the Ameland coast. The model uses wave conditions at 6m water depth that were transformed from offshore stations for all 14 profiles (Booij et al, 1999). And also average tidal currents were deerived at this depth from a tide-model. The Van Rijn (2007) formulation was used to compute longshore transport rates, using a D50 of 250 micrometer and default settings. All 18 historic sand nourishments were added, with a total of 26 million m3. And in addition to that also a source at the norhtwestern head of Ameland, which acted as a proxy for the bypass rate of the eb-delta. Calibration of the wave conditions was performed based on the observed coastlines from 2001 to 2020, which consisted of few degree adjustments of the incoming wave angles. Besides the hindcast, the goal was then make simulations with enhanced rates of sea level rise, with and without the bypass of the eb-delta.
Results
A shoal landing led to strong accretion of up to 400 meter at the island head between 2000 and 2010 (km 6 and 10), while the beach straightened along the Amelander sea inlet (km 2 to 6). The middle of the island (km 10 to 18) experienced coastal accretion of up to 100 meter, while the island tail was stable. Computed longshore transport ranged from -300,000 at the western head to about 1 million m3/yr at the tail of the island, resulting in large erosion gradients. More than 10 million m3 was therefore eroded between 2000 and 2010. This trend was reversed by nourishments from 2010 onwards. An important finding in this study was that coastline changes at the head of Ameland could not be achieved unless an artificial bypass of the eb-delta of 500,000 m3/yr was added. Even doubling transport rates or adjusting angles by over 10 degrees could not make up for this bypass transport, which indicates it is a real feature. Any reduction in this bypass can enhance island erosion in the future. Still, solutions to maintain the island could be found even for 25 mm/yr of sea level rise, but this will require a large effort.
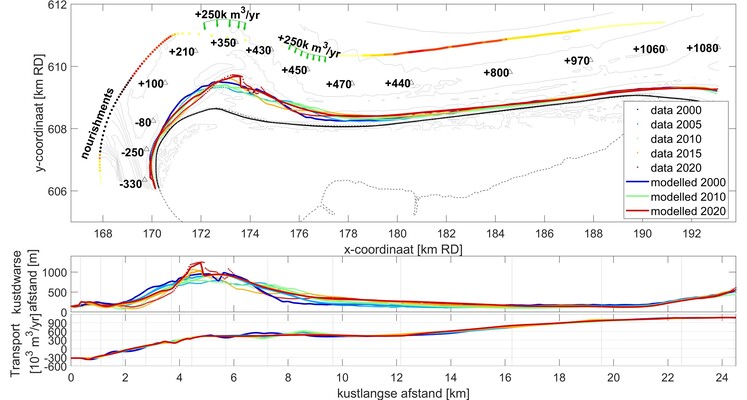
Observed and calculated coastal changes with the transports, cross-coastal losses and intensity of nourishments for Ameland (top panel), long-coastal representation of the coastal position (middle panel) and calculated transports along the coast by waves and tides (bottom panel).
References
Booij, N., R. C. Ris, and L. H. Holthuijsen (1999). A third-generation wave model for coastal regions: 1. Model description and validation. Journal of Geophysical Research, Vol. 104(C4), pp. 7649–7666.
Grasmeijer, B.T., Huisman, B.J.A., Luijendijk, A.P., Schrijvershof, R., Van der Werf, J.J., Zijl, F., de Looff, H. and De Vries, W. (2022). Modelling of annual sand transports at the Dutch lower shoreface. Ocean and Coastal Management, Vol. 217 (2022).
Huisman B.J.A., Walstra D.J.R., Radermacher M, de Schipper M.A., Ruessink B.G. (2019). Observations and Modelling of Shoreface Nourishment Behaviour. Journal of Marine Science and Engineering, Vol. 7(3):59.
Huisman (2024). Transporten in de ondiepe Nederlandse kustzone. Data en modelanalyse als basis voor de sedimentbalans van de ondiepe kust. Deltares Report. Opdrachtgever Rijkswaterstaat-WVL.
Van Rijn, L.C. (2007a). Unified view of sediment transport by currents and waves I: Initiation of motion, bed roughness, and bed-load transport. Journal of Hydraulic Engineering, Vol. 133, pp. 649–667.
Van Rijn, L.C. (2007b). Unified view of sediment transport by currents and waves II: Suspended transport. Journal of Hydraulic Engineering, Vol. 133, pp. 668–689.