
P.H.P. Overes1,2*, B.W. Borsje1, A.P. Luijendijk2,3, Z. Tam2,3, C.M.A. Bloem2,3, S.J.M.H Hulscher1
1 University of Twente, Netherlands; 2 Deltares, Netherlands; 3Delft University of Technology, Netherlands
* Corresponding author: p.h.p.overes@utwente.nl
Introduction
The interest in the offshore area is increasing at a rapid pace. This area supplies the key to realizing the energy transition, especially in densely populated regions like the Netherlands. Seabed level changes caused by dynamic bed forms, such as sand waves, may pose a threat for the offshore structures needed for producing and transporting green energy. To reduce risks, often dredging interventions are carried out before installation. However, it is generally unknown how the seabed will develop after these interventions. The data-driven analysis, which is usually applied for predicting future bed levels, is unsuitable for dealing with changes in the system caused by human interventions. To understand and predict the morphological development after human interventions, we need other tools, like numerical modelling. Numerical models have been applied to predict sand wave regrowth after dredging in a 2DV model setting (e.g. Campmans et al. 2021). However, when partially dredged sand waves are considered, data suggest that interactions occur between the dredged area and the surrounding sand waves, which cannot be included in 2DV sand wave models. Using 3D models insights can be gained into the processes leading to sand wave regeneration and related recovery timescales of trenched sand waves.
Objective and Methods
The goal of this study is to identify the processes which play a role in the hydrodynamics and sediment transport and their contributions to the long-term trench infill and sand wave regeneration after dredging. We setup a high-resolution 3D Delft3D Flexible Mesh model, based on field measurements of a cable trench situated offshore of Belgium. The bathymetry data shows recovery of the trenched sand waves over three years after dredging, see Figure. During this period the surrounding sand wave crests have lowered, indicating interactions between the sand waves and the trench. For these type of systems, we thus require a 2D horizontal analysis and, as sand waves generation needs vertical flows, this means 3D models. The three year period between measurements is hindcasted to allow for comparison of the morphological results with the measurements. The hydrodynamic conditions are extracted from the Dutch Continental Shelf Model and include both tidal and non-tidal forcing, such as meteorological conditions, following Overes et al. (2024). No morphodynamic upscaling is used and default bed-slope parameters are applied. Next to the long-term morphodynamics we focus on specific periods to investigate the influence of storm-induced currents and to see how the influence of processes changes over time.
Results
The results show that the infilling of the trench is mainly caused by slope induced transport at the trench slopes. This process is most prominently present at the crest location of the surrounding sand waves, where the side-slopes are steepest, thereby directly contributing to regrowth of the sand waves. Furthermore, the net sediment transport within the trench is directed from the trough to the crest location due to vertical, tide-averaged current circulation. The strength of these circulation cells, which is usually related to the sand wave height and steepness, is remarkably amplified within the flattened trench due to the influence of the surrounding, non-dredged sand waves. Lastly, the influence of storm-induced currents on infill volumes was found to be surprisingly limited, although the resulting asymmetry in infill location may drive sideways migration of the trench. Comparison with the measurement data shows that the model is well able to reproduce the lateral redistribution of sediment over the trench. This shows that 3D simulations can be used to reproduce multiyear morphological development of a trenched sand wave. Moreover, the gained insights into the driving mechanisms allow for better assessments of trench design and more accurate estimations of infill timescales.
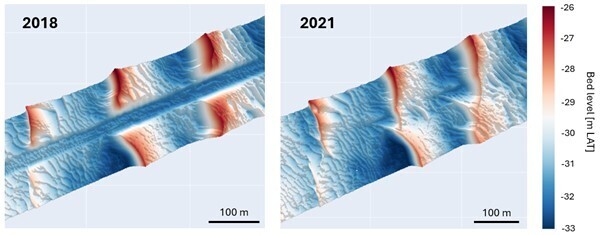
Bathymetry measurements showing cable trench through a sand wave field right after dredging (left) and infilled trench three years later (right).
References
Campmans, G. H. P., Roos, P. C., Van der Sleen, N. R., & Hulscher, S. J. M. H. (2021). Modeling tidal sand wave recovery after dredging: effect of different types of dredging strategies. Coastal engineering, 165, 103862. https://doi.org/10.1016/j.coastaleng.2021.103862
Overes, P. H. P., Borsje, B. W., Luijendijk, A. P., & Hulscher, S. J. M. H. (2024). The importance of time-varying, non-tidal currents in modelling in-situ sand wave dynamics. Coastal Engineering, 104480. https://doi.org/10.1016/j.coastaleng.2024.104480