
Hailey Bond1*, Meagan Wengrove2 , Matthew P. Conlin2, Greg Wilson2, Jonathan Allan2
1 Oregon State University, Corvallis, Oregon, USA; 2 Oregon Department of Geology and Mineral Industries, Newport, Oregon, USA
* Corresponding author: bondh@oregonstate.edu
Introduction
Composite beaches are composed of a gently sloping sandy foreshore backed by a steep cobble berm that evolves over time under wave impact. Composite beaches are common in locations including the United Kingdom, New Zealand, Canada, and the Pacific Northwest of the United States (PNW). Composite beaches have been noted to be a relatively stable beach type (Allan et al. 2005), and are a natural analog to dynamic cobble berm revetments. Dynamic cobble berm revetments can be a suitable alternative to hard structures such as riprap revetments when a nature-based solution is desired in an energetic wave environment, but beach nourishment is not practical. The cobbles that make up a dynamic cobble berm revetment move and roll during wave impact and dissipate wave energy. The shape of a dynamic cobble berm revetment is expected to change over time, and some alongshore transport of the cobbles is expected. Understanding the controlling factors of the alongshore transport rate of cobble is important for determining the resilience of composite beaches and for developing maintenance requirements for dynamic cobble berm revetments. However, the relative importance of the different drivers of alongshore transport of cobbles on composite beaches is not well understood.
Objective and Methods
The objective of this study is to collect field observations of alongshore cobble transport on two natural composite beaches in Oregon (Arch Cape and Falcon Cove) and a dynamic cobble berm revetment in Washington (Westport) to elucidate potential relationships that may be viable as predictors of alongshore cobble transport rates. We adopted the procedures of Allan et al. (2006), who used Radio Frequency Identification technology (RFID) to track the transport of cobbles. We collected and tagged ~100 cobbles from each beach with RFID tags. The cobbles ranged in size, and represented the grain size distribution measured at the sites. We replaced half of the cobbles collected from each site in Fall 2023 and the remaining cobbles in January 2024. Throughout the 2023-2024 winter season, the cobble berm was searched 1-2 times per month with a handheld RFID antenna and cobble locations were recorded with an RTK-GPS system. For analysis, the alongshore displacement for each cobble was calculated between each survey. Wave data from offshore buoys and tide data from nearby tide stations were used to calculate the cumulative number of hours that runup exceeded the toe elevation of the cobble berm (Stockdon et al. 2006).
Results
The dominant transport direction of cobbles for the two natural composite beach sites was northward. On average (and maximum), cobbles traveled 22 m (130 m) at Arch Cape and 45 m (150 m) at Falcon Cove over the 6-month experiment. The runup hours and transport distance appeared to be related. Over the first 2 months at both Oregon sites, the runup hours above the cobble toe were 125 and 300 hrs, respectively, and the average cobble displacement was negligible. However, high spring tides, increasing wave heights, and the erosion of sand in the third month caused the increase of runup hours to 677 and 685 hrs and the increase of the average cobble displacement to 6.5 m and 24 m. Observations at Westport showed negligible cobble movement, likely due to the relatively few hours of runup interaction related to the higher elevation of the cobble toe. (Figure 1). This result indicates that the runup elevation is an important predictor of cobble transport, a result which is not currently captured in any coarse-grained alongshore transport equations. Future work will investigate variables such as cobble elevation, cobble mass, and wave direction to quantify their influence on the alongshore transport rate.
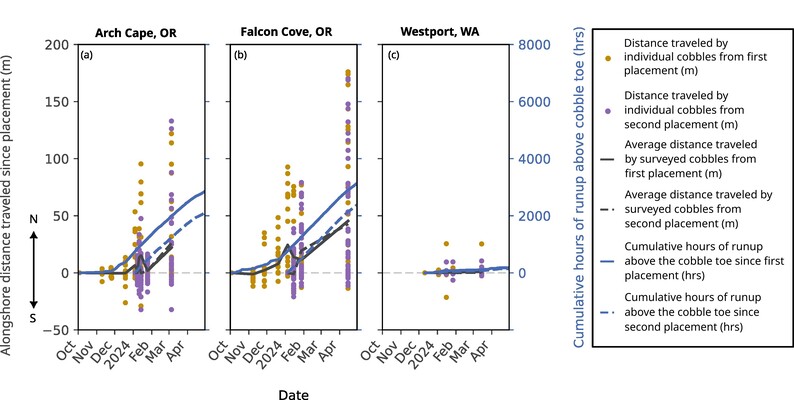
Figure 1: Total alongshore displacement of each cobble from its starting position on each survey date (dots) and average total alongshore displacement (grey solid/dashed line). Cumulative hours of runup above the cobble toe since cobble placement are displayed on the right y-axis (blue solid/dashed line).
References
Allan, J. C., R. Geitgey, and R. Hart. 2005. Dynamic Revetments for Coastal Erosion in Oregon.
Allan, J. C., R. Hart, and J. V. Tranquili. 2006. “The use of Passive Integrated Transponder (PIT) tags to trace cobble transport in a mixed sand-and-gravel beach on the high-energy Oregon coast, USA.” Mar. Geol., 232 (1–2): 63–86. https://doi.org/10.1016/j.margeo.2006.07.005.
Stockdon, H. F., R. A. Holman, P. A. Howd, and A. H. Sallenger. 2006. “Empirical parameterization of setup, swash, and runup.” Coast. Eng., 53: 573–588. https://doi.org/10.1016/j.coastaleng.2005.12.005.
