
M.P. Bénit1*, V. Vuik1 , K. Saman2 , J. Simonse2 , W. Huibregtse2 , V. Sperber2, D. Rovers1
1 HKV Lijn in water B.V., the Netherlands; 2 Rijkswaterstaat Zee en Delta, the Netherlands
* Corresponding author: benit@hkv.nl
Introduction
The Eastern Scheldt storm surge barrier (OSK) plays a critical role in coastal protection, mitigating extreme wave impacts and water levels, while maintaining tidal exchange with the estuary. The wave conditions at the OSK are derived in a series of steps, summarized as:
- Modelling of the wave transformation from the North Sea to the barrier using the spectral wave model SWAN for various stationary, uniform wind and water level conditions and in absence of flow,
- Correction of the model outcomes (significant wave height, Hm0 and mean wave period, Tm-1,0) for bias with nearby wave measurements,
- Derivation of a maximum individual wave height, Hmax, and corresponding wave period THmax, based on a wave height distribution function.
- Translation of wave conditions into wave pressures on the gate and stresses in the gates and pillars (not considered in this study).
The ebb tidal delta of the Eastern Scheldt affects the wave conditions (Hm0, Tm-1,0, Hmax, THmax) through (spectrally varying) attenuation of wave conditions (step 1), changing the Hmax/Hm0 ratio at shallow areas (step 3).
Objective and Methods
Our objective is to analyze how the failure probability of the OSK changes with alternate assumptions regarding the effect of the delta on the wave loads.
The ratio between Hmax and Hm0. Previous assessments used a Rayleigh distribution to establish the ratio of Hmax/Hm0, which does not account for bathymetric effects and non-gaussian wave shape in non-linear waves. A closer inspection of the SWAN model results, contrastingly indicated that local bathymetric effects may play a role. We have applied the Battjes-Groenendijk, which accounts for depth-induced wave breaking effects, using various assumptions. The presence of a sill at the crossing of the ebb and flood channels was a factor of particular interest.
The representation of refraction in SWAN. A limitation of the wave model SWAN is its poor representation of long-wave refraction over steep channel slopes. SWASH better captures this phenomenon, although at increased computational costs and without the local effects of wind. We conduct SWASH simulations to assess the impact of long-wave refraction on the wave loads at the OSK. We simulate conditions closely matching SWAN calculations at the design point of the OSK to facilitate a direct comparison of short and long wave propagation.
Results
The ratio between Hmax and Hm0. The SWAN model indicates that various bathymetric variations (channel slopes and sills (-10 m+NAP) in front of the ebb channels (~ -15 m+NAP)) alter the wave conditions significantly. Modifying our assumptions on the representative water depths, bottom slopes and storm duration, the calculated Hmax/Hm0-ratio varied between values of 1.94 (deep water), 1.73 (sill depth) and 1.53 (nearby flats). Analysis of wave measurements showed that deviation from the Rayleigh distribution varies with Hm0, in part explained by an associated increase in wave period and in part by increase depth induced breaking. The scatter in the data is very large and substantial maximum individual wave heights above the Rayleigh estimate were found. Ultimately we demonstrated that applying Hmax/Hm0=1.73 results in a reduction factor of structural failure probabilities of individual gates between 2.5 and 5.5. We recommended a cautious reduction of 5% to the Hmax based on the Rayleigh distribution, and further analysis into individual wave propagation and explicitly representing the uncertainty.
The representation of refraction in SWAN. Building onto the previous, a SWASH model simulation is conducted to study the refraction of longer and shorter waves on channel slopes and subsequent reduction of the maximum wave heights. The results will be presented at the conference.
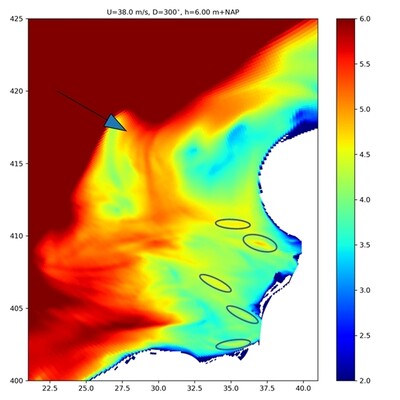
SWAN model output of significant wave height Hm0 (m) for a wind speed of 38 m/s with direction 300°N (arrow) and a uniform water level of NAP+6 m. Circles: shallow flats with an increased significant wave height along the channels leading to the OSK.
References
Rijkswaterstaat (2022) Wettelijke beoordeling traject 218, OosterscheldekeringVeiligheidsrapportage. Versie 4.0, definitief, 20 september 2022. https://waterveiligheidsportaal.nl/nss/assessment-lbo1
Vuik, V., (2021) WBI-beoordeling Oosterscheldekering : modelonzekerheden golven. HKV PR4119.10, April 2021
Battjes J.A., Groenendijk H., (2000) Wave height distributions on shallow foreshores, Coastal Engineering, olume 40, Issue 3, 2000, Pages 161-182, ISSN 0378-3839, https://doi.org/10.1016/S0378-3839(00)00007-7.
Rovers, D.L.T. (2024) Impact of wave load-related model choices on structural failure probabilities A case study of the Eastern Scheldt barrier. M.Sc. thesis Delft University of Technology, 2024. https://resolver.tudelft.nl/uuid:0201990f-e01f-463a-a4ff-61be4d2c5c43
van Dongeren, A.R. et al. (2009) Penetration of North Sea waves into the Wadden Sea : SBW-Waddenzee - phase 3: fallback options. Deltares, 14 oktober 2009. https://open.rijkswaterstaat.nl/open-overheid/onderzoeksrapporten/@48278/penetration-north-sea-waves-into-the/
Groeneweg, J. et al. (2014) Modelling of wave penetration in complex areas: analyses of hindcast data. Deltares, 1 december 2014. https://open.rijkswaterstaat.nl/open-overheid/onderzoeksrapporten/@95711/modelling-wave-penetration-complex-areas/#highlight=groeneweg%20complex